How we did it
The design in plain terms, for readers who do not work with value-added models.
We ran the tests ourselves
Value-added estimates need the same students measured twice, at the classroom level, within a single school year. In most middle-income countries that data simply does not exist: national assessments arrive too infrequently, or cannot be linked to the teacher who actually taught the class. So the research team collected it. Students sat a baseline mathematics test in May 2016 and an endline in November 2016, in 169 classrooms across 59 schools, grades 9 through 11 — 3,756 students and 114 mathematics teachers in total.
That is what makes teacher-level learning gains measurable here at all, and it is why the study is a single school year rather than a panel.
What SEPA measures, and why not SIMCE
The assessment is SEPA — Sistema de Evaluación de Progreso del Aprendizaje — the learning-progress test developed by MIDE-UC, the measurement centre at the Pontificia Universidad Católica de Chile. It was administered by external proctors rather than by the schools themselves, at the start of the 2016 school year in May and again at the end in November.
Chile does have a national assessment, SIMCE, and it is not the right instrument here: it is not designed to follow the same students across a single school year, so it cannot separate what a teacher added from what students already knew when they walked in. SEPA is built for exactly that comparison, which is why the study runs on it.
How value-added is built from those scores
The construction follows Chetty, Friedman and Rockoff, using those authors' vam implementation. Test scores are residualised on school and class covariates — region, municipal dependency, school SES tier, and class size — with teacher effects estimated from within-teacher variation across the baseline and follow-up waves. Class-level follow-up residuals are then projected on baseline class residuals, and the resulting predicted residual learning is standardised across the teachers in the analytic sample.
Two details of that last step govern how every σ on this site should be read. The estimates are reported unshrunk, so one σ is one standard deviation of the estimated teacher-effect distribution, not of true teacher quality. And a single year of data leaves classroom-level noise in those estimates, which inflates that standard deviation. Both push the same way: the gradients reported here are conservative rather than overstated.
We linked to administrative records
Each teacher's own PSU/PAA university entrance score comes from the national administrative record, so pre-college human capital is measured before any of them decided how to become a teacher — it cannot be contaminated by the training route being studied. Teaching experience and career history come from the Ministry of Education's teacher service panel.
Together, those two links let the analysis hold ability and experience side by side against measured student learning, and let the sample be placed against a national reference cohort of roughly 17,700 teachers.
The comparison group is deliberately not representative
Enseña Chile recruits cluster at the very top of the ability distribution — the 97th percentile, +1.9 SD above the mean teacher. A nationally representative comparison group would therefore have almost no overlap with them on ability, and any route difference would be hopelessly confounded with the ability difference. There would be nothing to compare like with like.
So the team stratified non-partner schools by their teachers' entrance-score decile and invited at least one school per decile. That buys overlap in ability across the whole range, which is exactly what the reweighting to the national common-support distribution needs in order to work.
The price is representativeness: the comparison teachers are not a picture of the average Chilean mathematics teacher, and no number on this site should be read as one. That is a design choice with a reason, made to answer the question about the route rather than a question about the national average.
What the decomposition does
With the comparison group reweighted onto the common-support ability distribution, the remaining gap is split into the part attributable to the ability difference, the part attributable to Enseña Chile teachers all being in year one or two, and whatever is left over. The leftover is reported with its confidence interval rather than described as a training effect.
The arithmetic is additive and descriptive. It attributes an observed gap to observed differences; it does not identify what would happen if a given teacher had taken the other route.
Where the testing ran
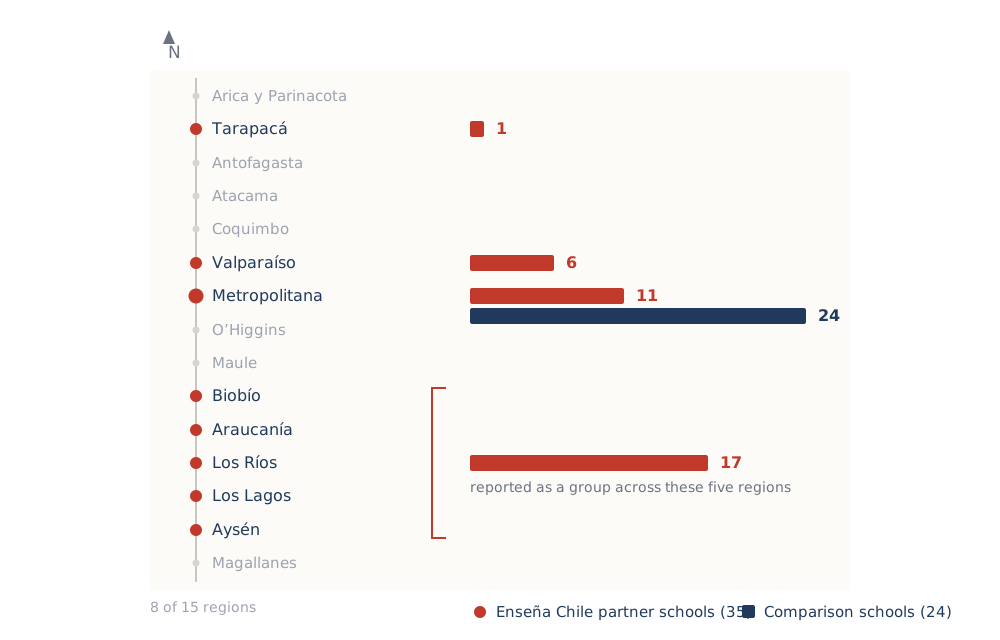
The 35 Enseña Chile partner schools contributing teachers span 8 of Chile's 15 regions, from Tarapacá in the north to Aysén in the far south; the 24 comparison schools sit in the Metropolitan Region by design, where 40% of Chilean students are enrolled.